
UPDATE 7/16/2020: New Version Released; V 1.4.2
Cross I.T. Services & Solutions, LLC is proud to offer to the public a FileMaker based, web accessible data visualization tool for the current global pandemic: COVID-19.
This page will serve as a brief guide for how to use the Pandemic Visualizer, and will also include information on version specific updates.
Versions
A web based demo of the solution can be viewed here.
A new version is now available for download click here to download -> Pandemic Visualizer 1.4.2
For a copy of the previous version, click here -> Pandemic Visualizer 1.3.4.
For an unlocked copy please contact our development team at FileMaker@crossit.com
Version Update Information
Version next – minor fixes and additional charts TBD
v 1.4.2 – Most recent stable version, released 7/16/2020 ; more efficient generation of charts; addition of pie chart and bar chart to map pages; minor interface improvements; improved syncing of data
v 1.3.4 – Includes international and state geo frequency maps with tables views of data; includes customizable bar chart; locked down copy only
General Information
- The tool contains two major data visualizations: a geographical chart showing frequency of requested data points, and a bar chart that can be customized to show different data sets.
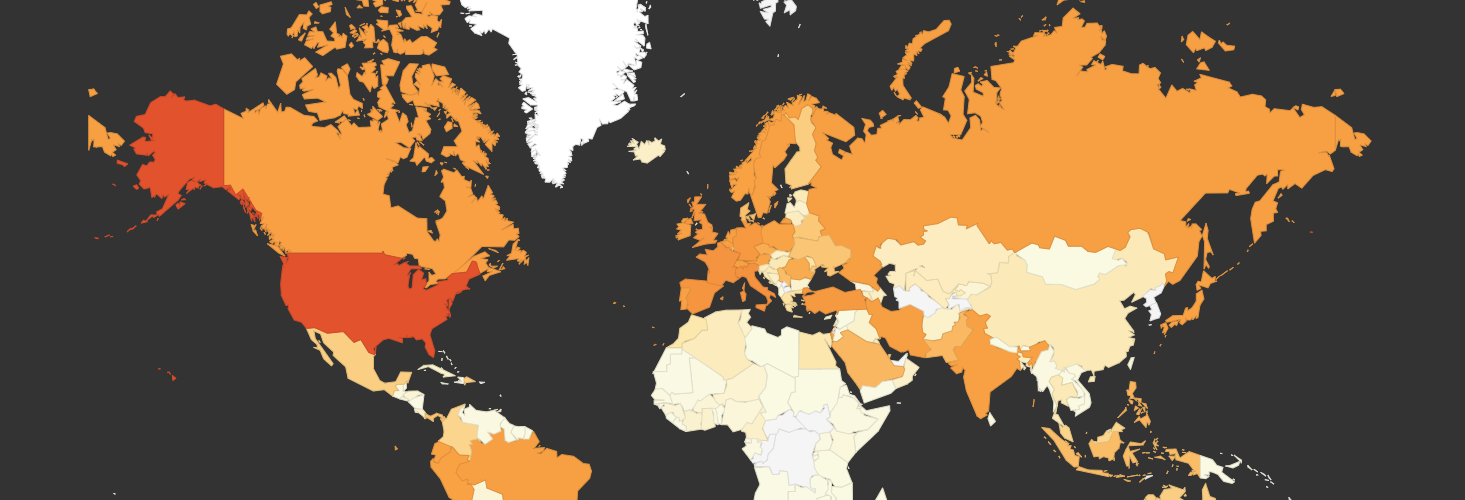
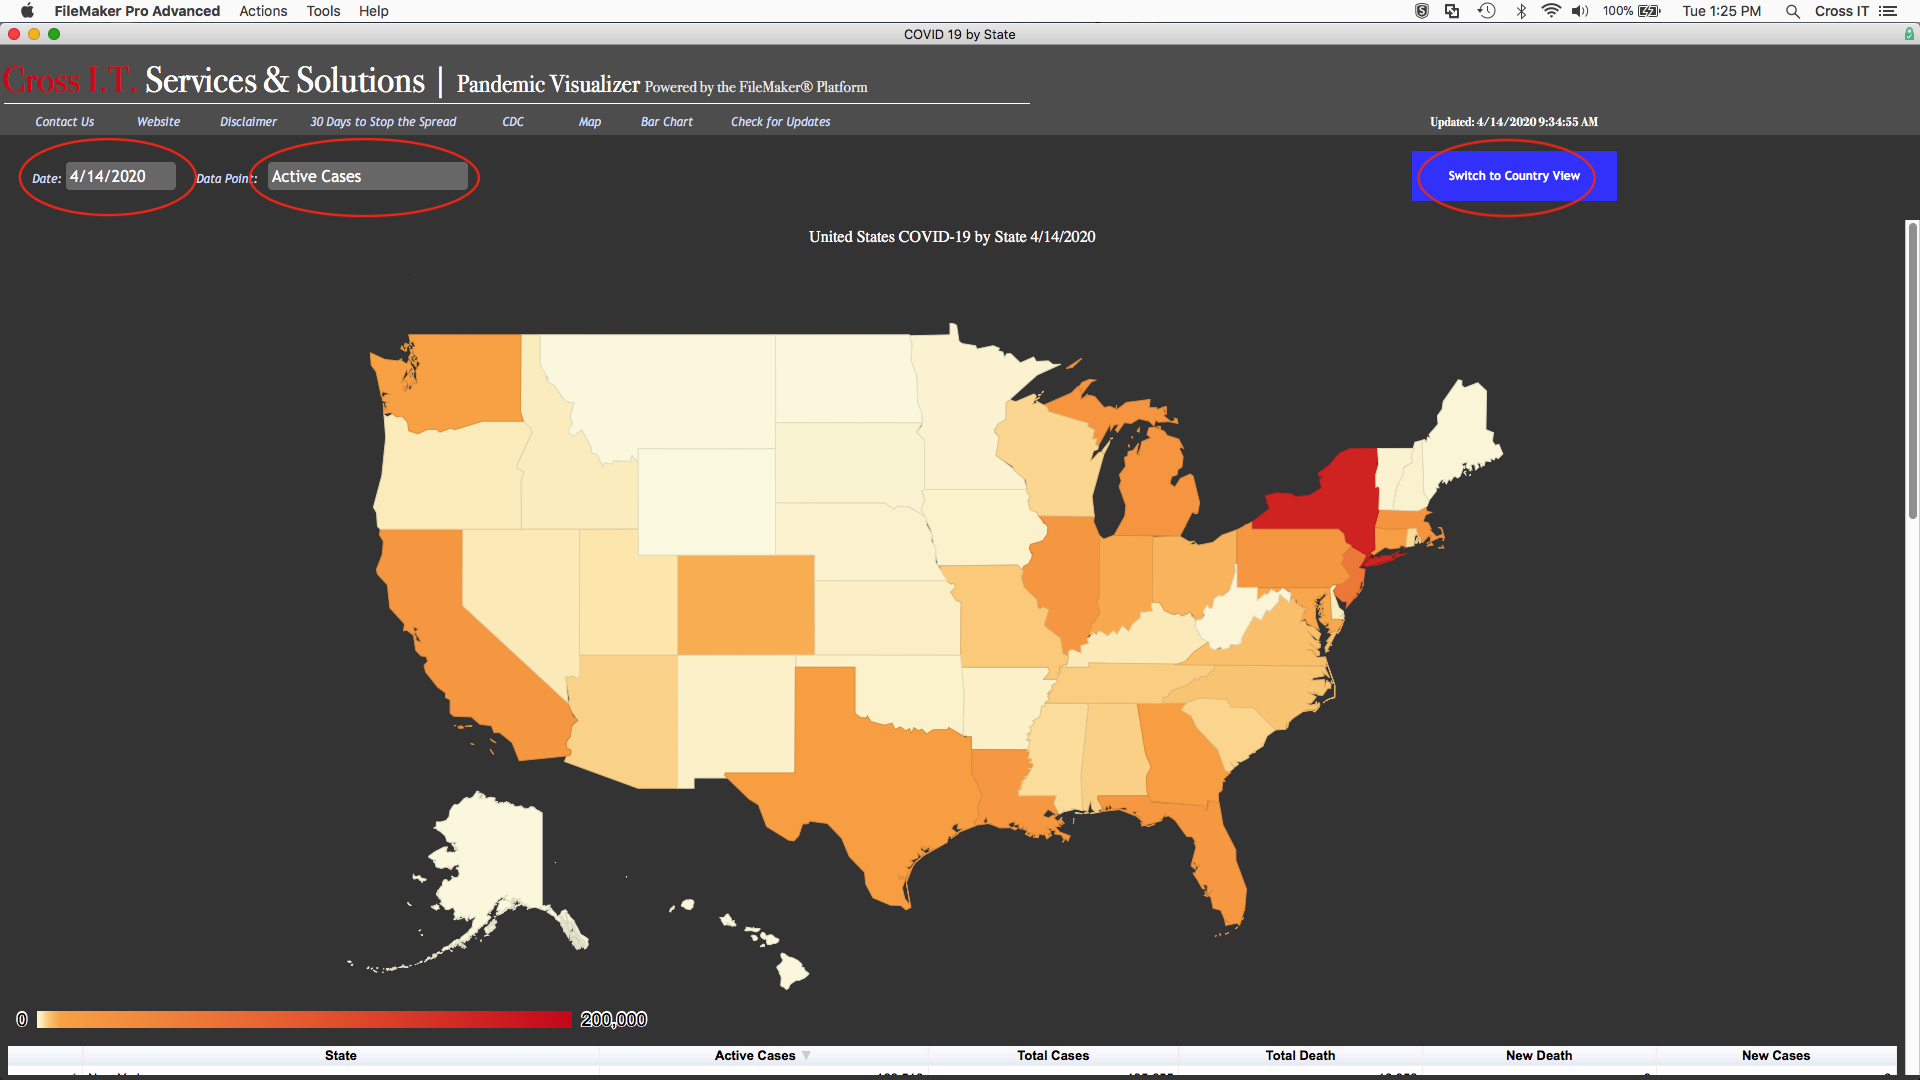
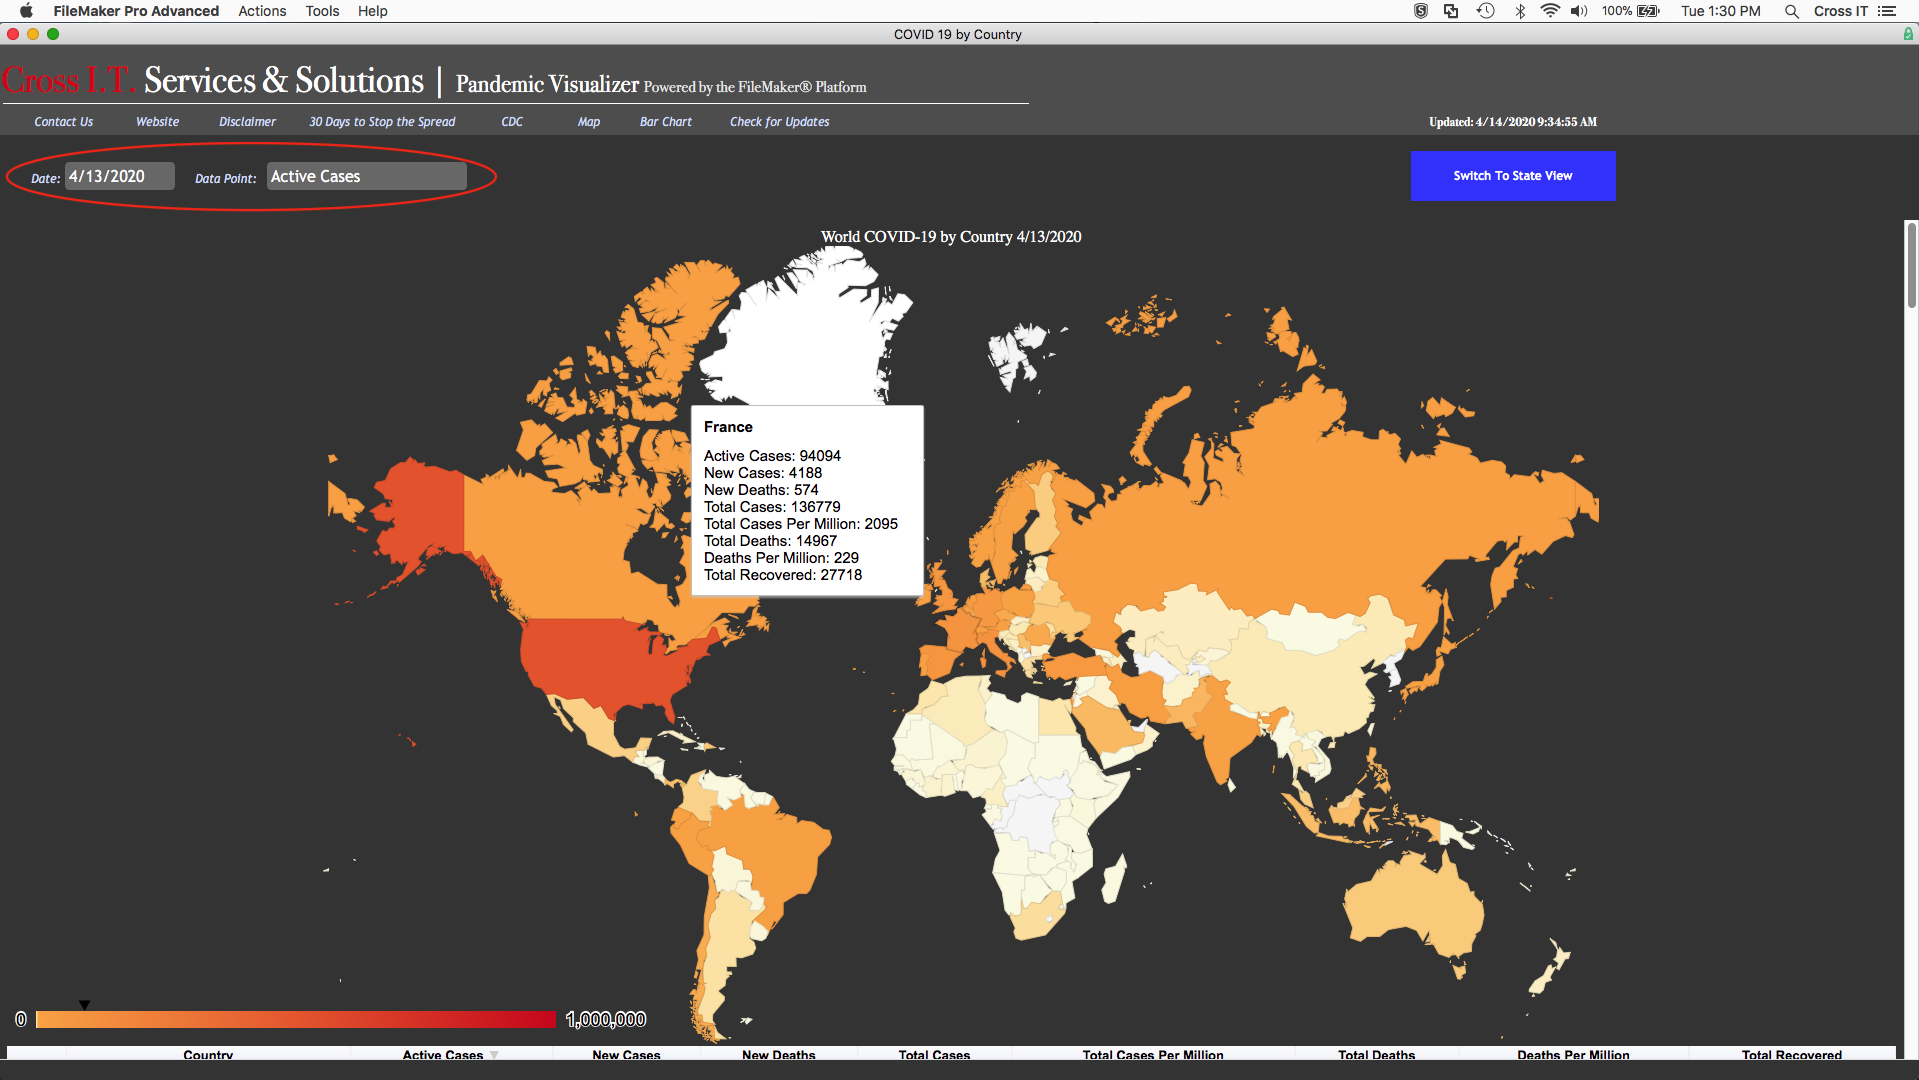
- The geographical frequency chart can be set to display either to focus on the States of the United States of America, or set to show the entire world.
- The bar chart currently only works for “State” wide data
- The solution is almost completely “Locked Down” from a FileMaker perspective. The only thing users can do is utilize the data visualizations, and check for updates. If you would like an unlocked copy please contact a member of our development team at FileMaker@crossit.com
FileMaker Requirements:
- In order to utilize this file, you must have a valid version of the FileMaker Platform that meet the below requirements
- Required FileMaker Version: FileMaker 17 or newer
- Supported FileMaker Platforms:
- Hosted via FileMaker Server can be accessed via FileMaker WebDirect, FileMaker Pro Advanced, FileMaker Go
- Not hosted can be accessed via FileMaker Pro Advanced
- For more details on FileMaker Platform specifications please click these links: FileMaker 17 or FileMaker 18
Checking For Updates
- Data for COVID-19 is updated regularly and maintained by Cross I.T. team members. Please note we are not medical professionals and none of the data posted should be used for official or research purposes. We will do our best to maintain accurate and up to date information.
- Your local copy of the Pandemic Visualizer is set up to sync with data hosted on a master copy of the database hosted on Cross I.T.’s servers. This syncing is done via the FileMaker REST API.
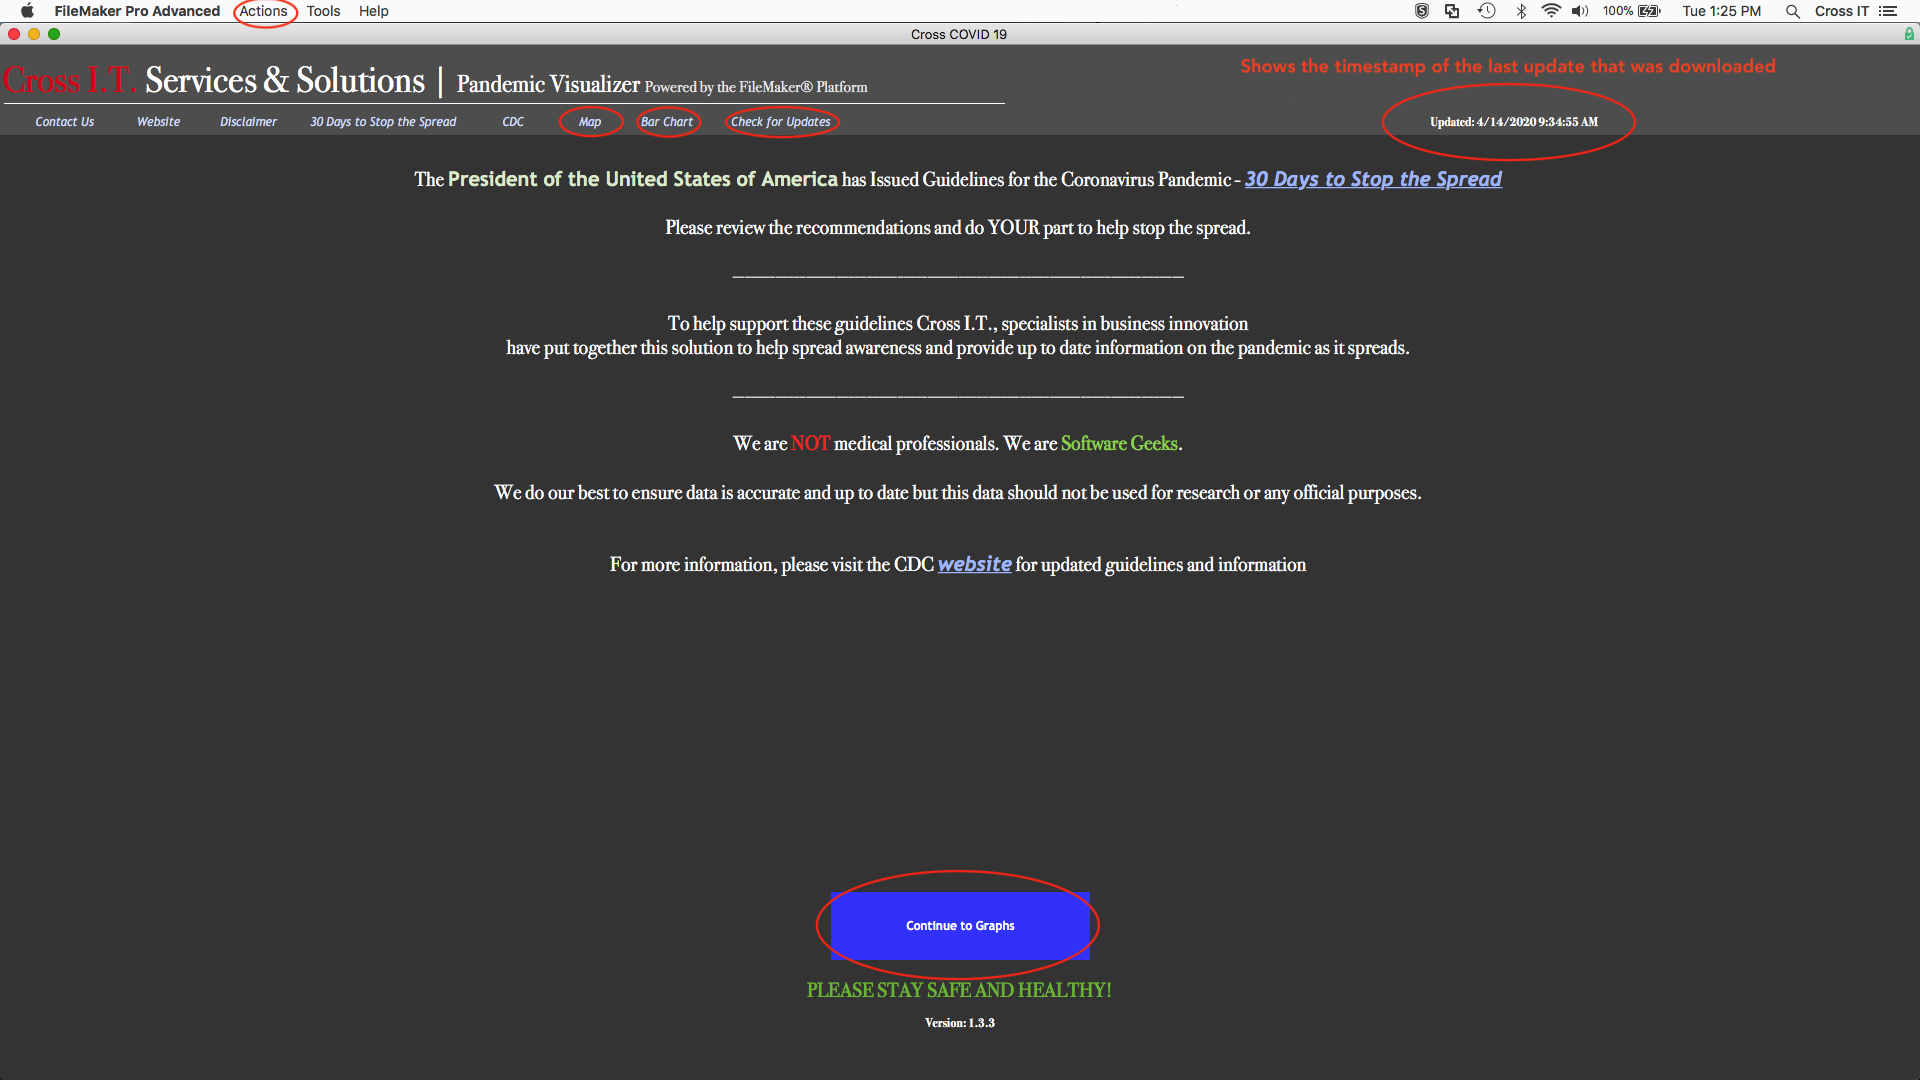
- In order to synchronize data and update information you must open the Pandemic Visualizer via FileMaker Pro Advanced and click “Check for Updates” ( shown below ). Alternatively you can go to the top menu bar, click actions > check for updates.
- If no updates have occurred, you will received a pop up message notifying you that your solution is up to date
- If there are updates that have not been pushed out to your solution, your file will start downloading the data from our servers. You will need an internet connection of some form for this process. Once completed you will automatically be guided to one of the map visualizations.
- Please note, updating can only be done from FileMaker Pro Advanced, and cannot be done from the web or on FileMaker Go
- General Information about updates
- Information updated may include:
- State Data per day- active cases, new cases, total cases, total deaths, new deaths
- International Data per day – active cases, new cases, total cases, total deaths, new deaths, total cases per million, deaths per million, recovered
- Settings – disclaimer message, CDC website link, government information link and wording, map visualization frequency colors, other meta data not visible to the user
- Updates are based on time stamp. Every time you pull updated information from our server, it will record the time when that update was run based on the time and date of Cross I.T.’s hosted server. If the last update you downloaded is not the most recent one on our server, it will download that update. Otherwise it will notify you that the solution is up to date
- If you have not ‘checked for updates’ within multiple days, please be aware the solution might take extra time to download all updates.
- Information updated may include:
Layouts / Pages
Disclaimer Page: The first page users are navigated to once the solution opens. This page will contain any messages from the development team or any relevant announcements and will be updated as needed.
Maps Page: A page showing a state or international map showing frequency by color. The data point and date shown can be selected by the user. Hovering over a state or country will show all data for that day for that state or country.
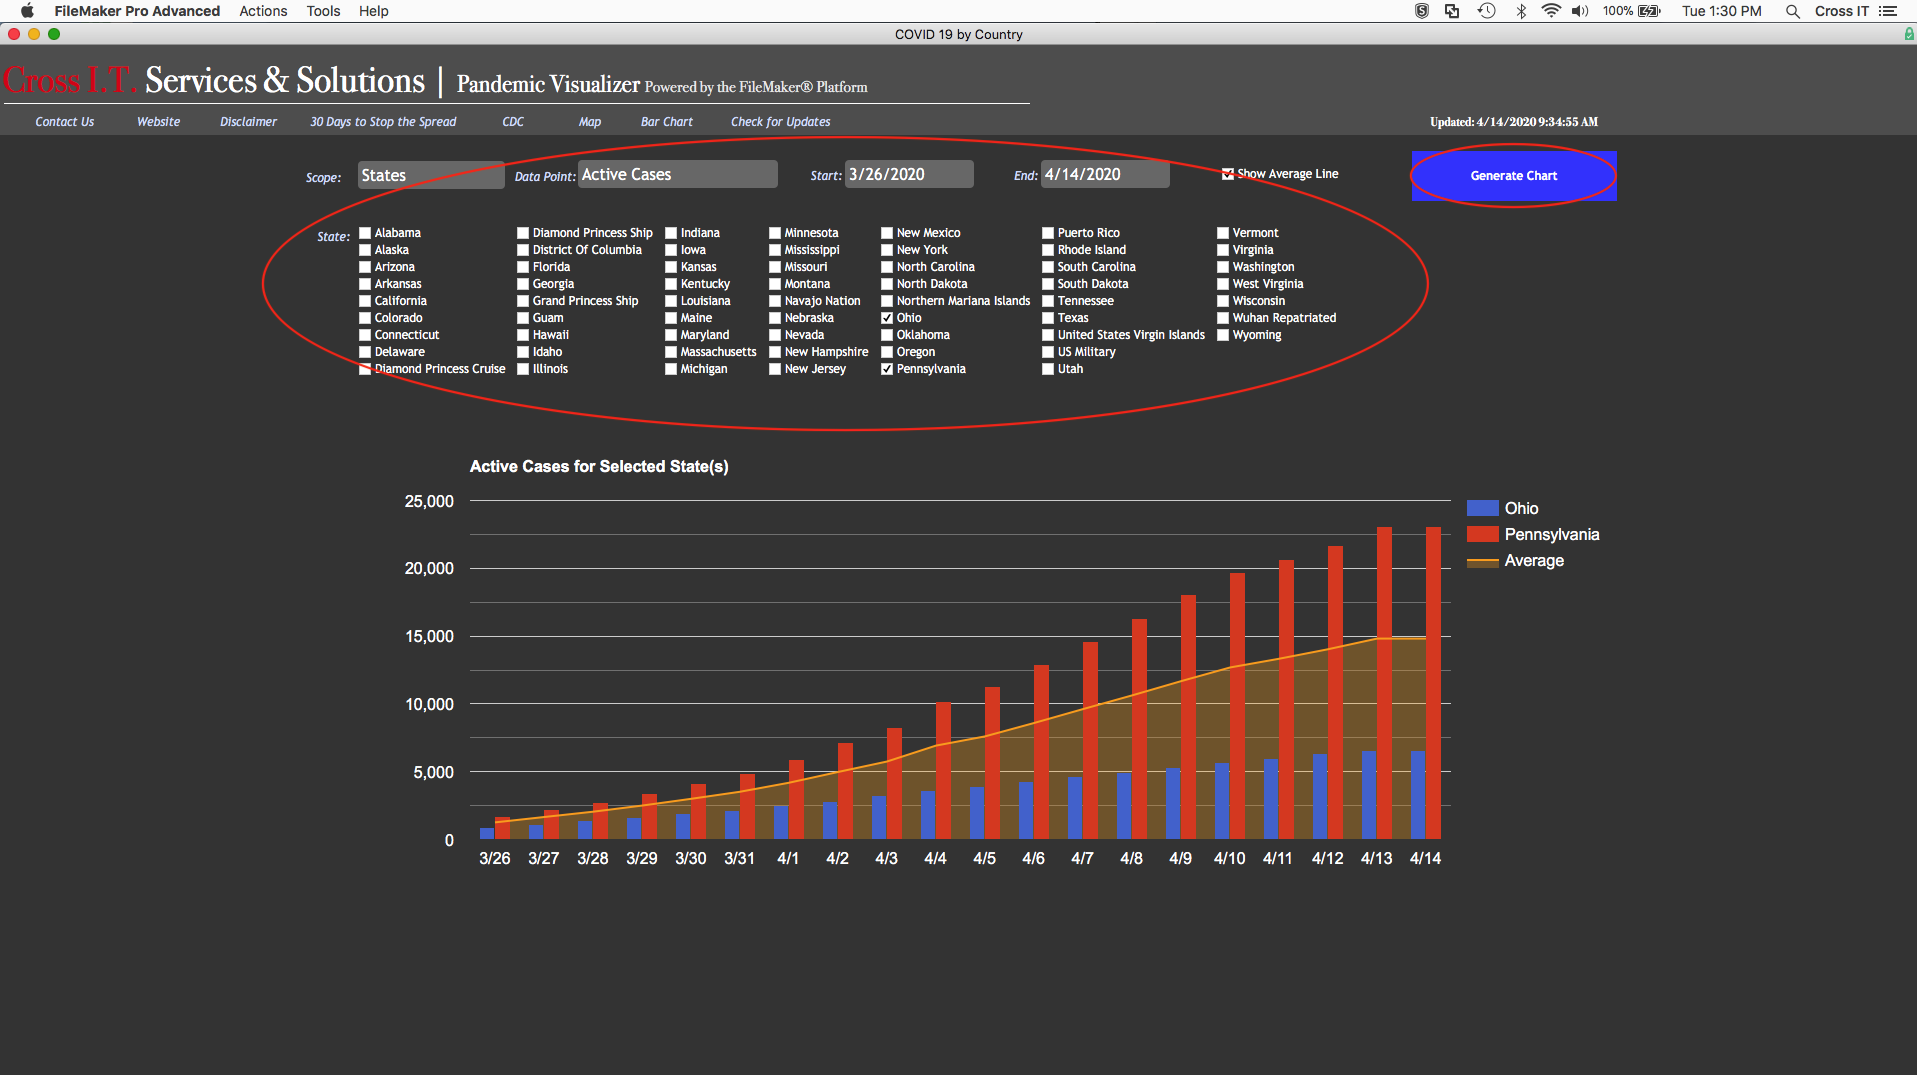
Bar Chart Page: A page with options to generate a custom bar chart. Options include date range and data point, along with option to select multiple states and an option to see an ‘average’ line.
Links to other websites: In addition to the above pages, there are links to externally supported websites. We include two links specifically to government websites. One is the CDC’s website for this pandemic. The other is a link to a relevant website. This link might change depending on what is recently relevant. In the screen shots below it shows the “30 days to stop the spread” information. In future updates, it will be a link to the recently announced “Guidelines for Opening Up America” website.
Screenshots and Visual Guide
Disclaimer Page – this is the default starting page. Click ‘Continue to Graphs’ or select ‘Map’ or ‘Bar Chart’ Frequency Geo – States – Select a date and what data point you would like to show Frequency Geo – International – note when hovering over a country or territory on the map it shows additional detail Bar Chart – the bar chart allows users to compare statistics for one or more states. Unlike the maps, users will have to hit ‘update’ chart to generate the chart


